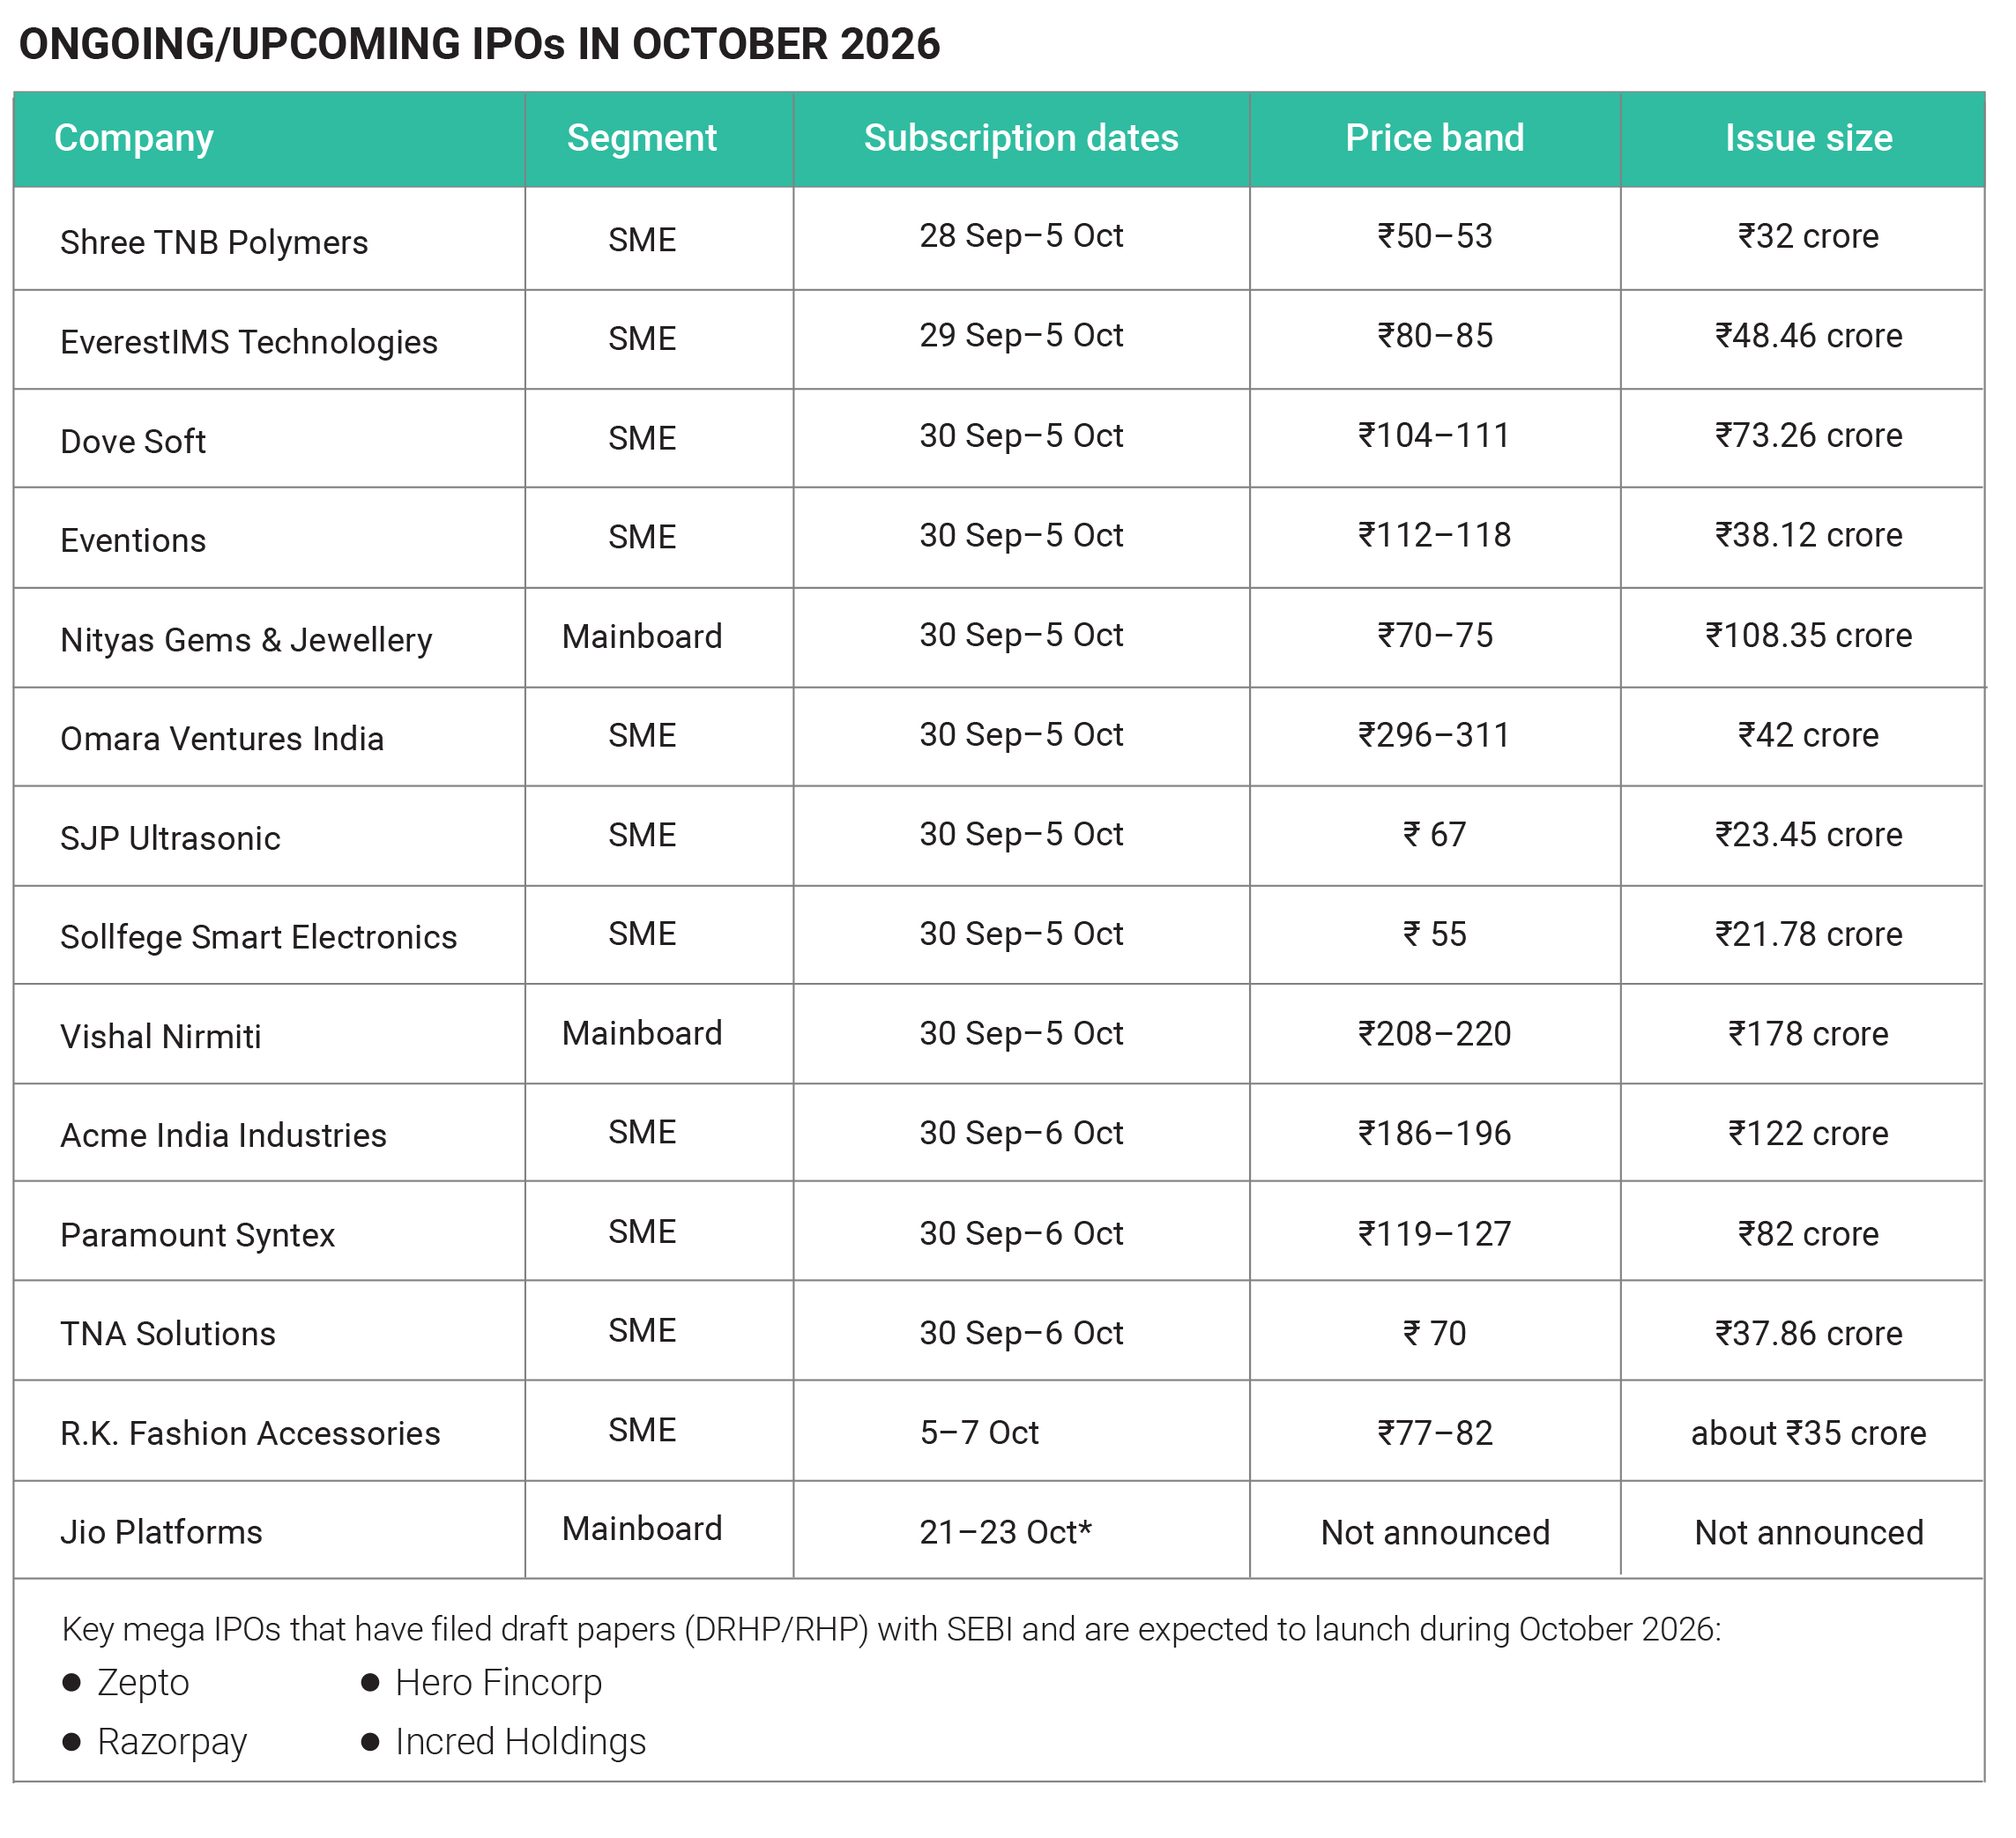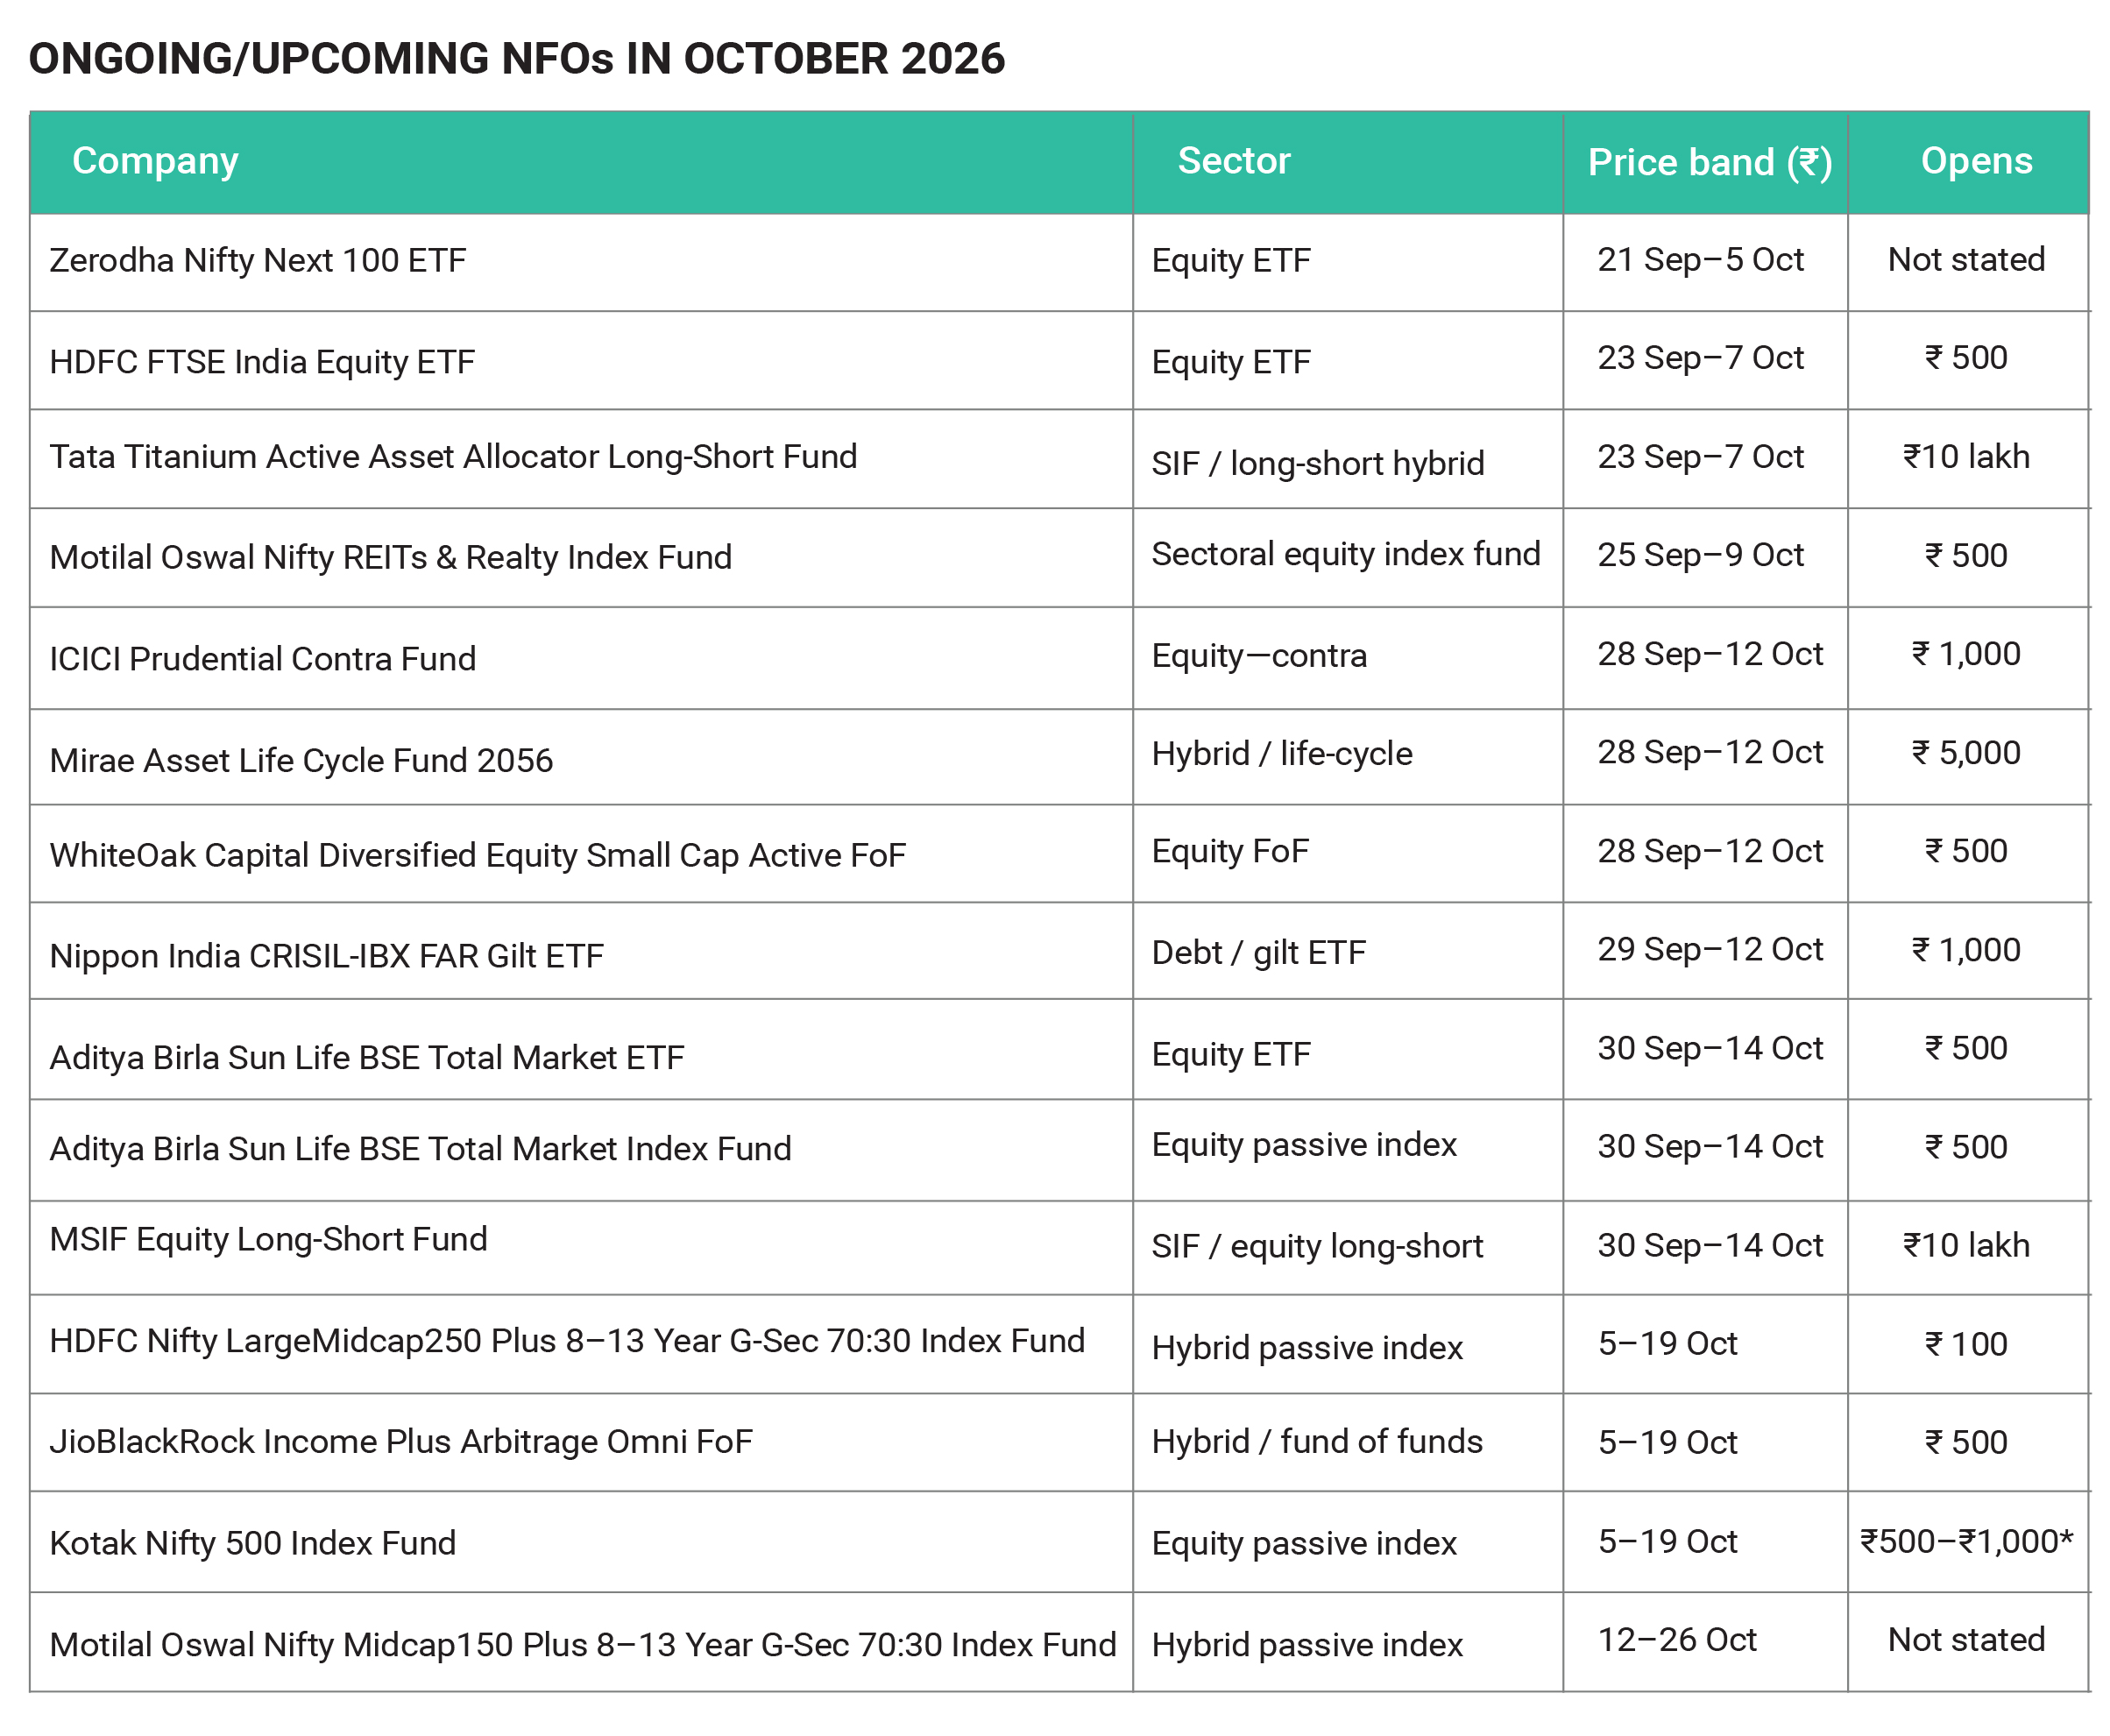
September 2026 was one of the weakest months in years for Indian equities, with both the Nifty 50 and the BSE Sensex recording their second consecutive monthly decline. According to the newer reference text, the Nifty 50 fell 6.06% on a spot month-end basis, losing about 1,472 points to close at 22,620.45 on September 30. The Sensex fell about 5.8%, losing roughly 4,476 points to close at 72,480.29. The Nifty's September derivatives series return was reported at about -6.7%, which one source called the worst September in 25 years, so the figure depends on whether month-end spot levels or the derivatives series is used. The earlier text had slightly milder numbers, with the Nifty down about 5.7% and the Sensex down about 5.3% to 5.5%, ending near 72,700 to 72,800. Taken together, the sources agree on a severe correction, with the Nifty down roughly 5.7% to 6.7% and the Sensex roughly 5.3% to 5.8%, and both benchmarks near six-month lows.
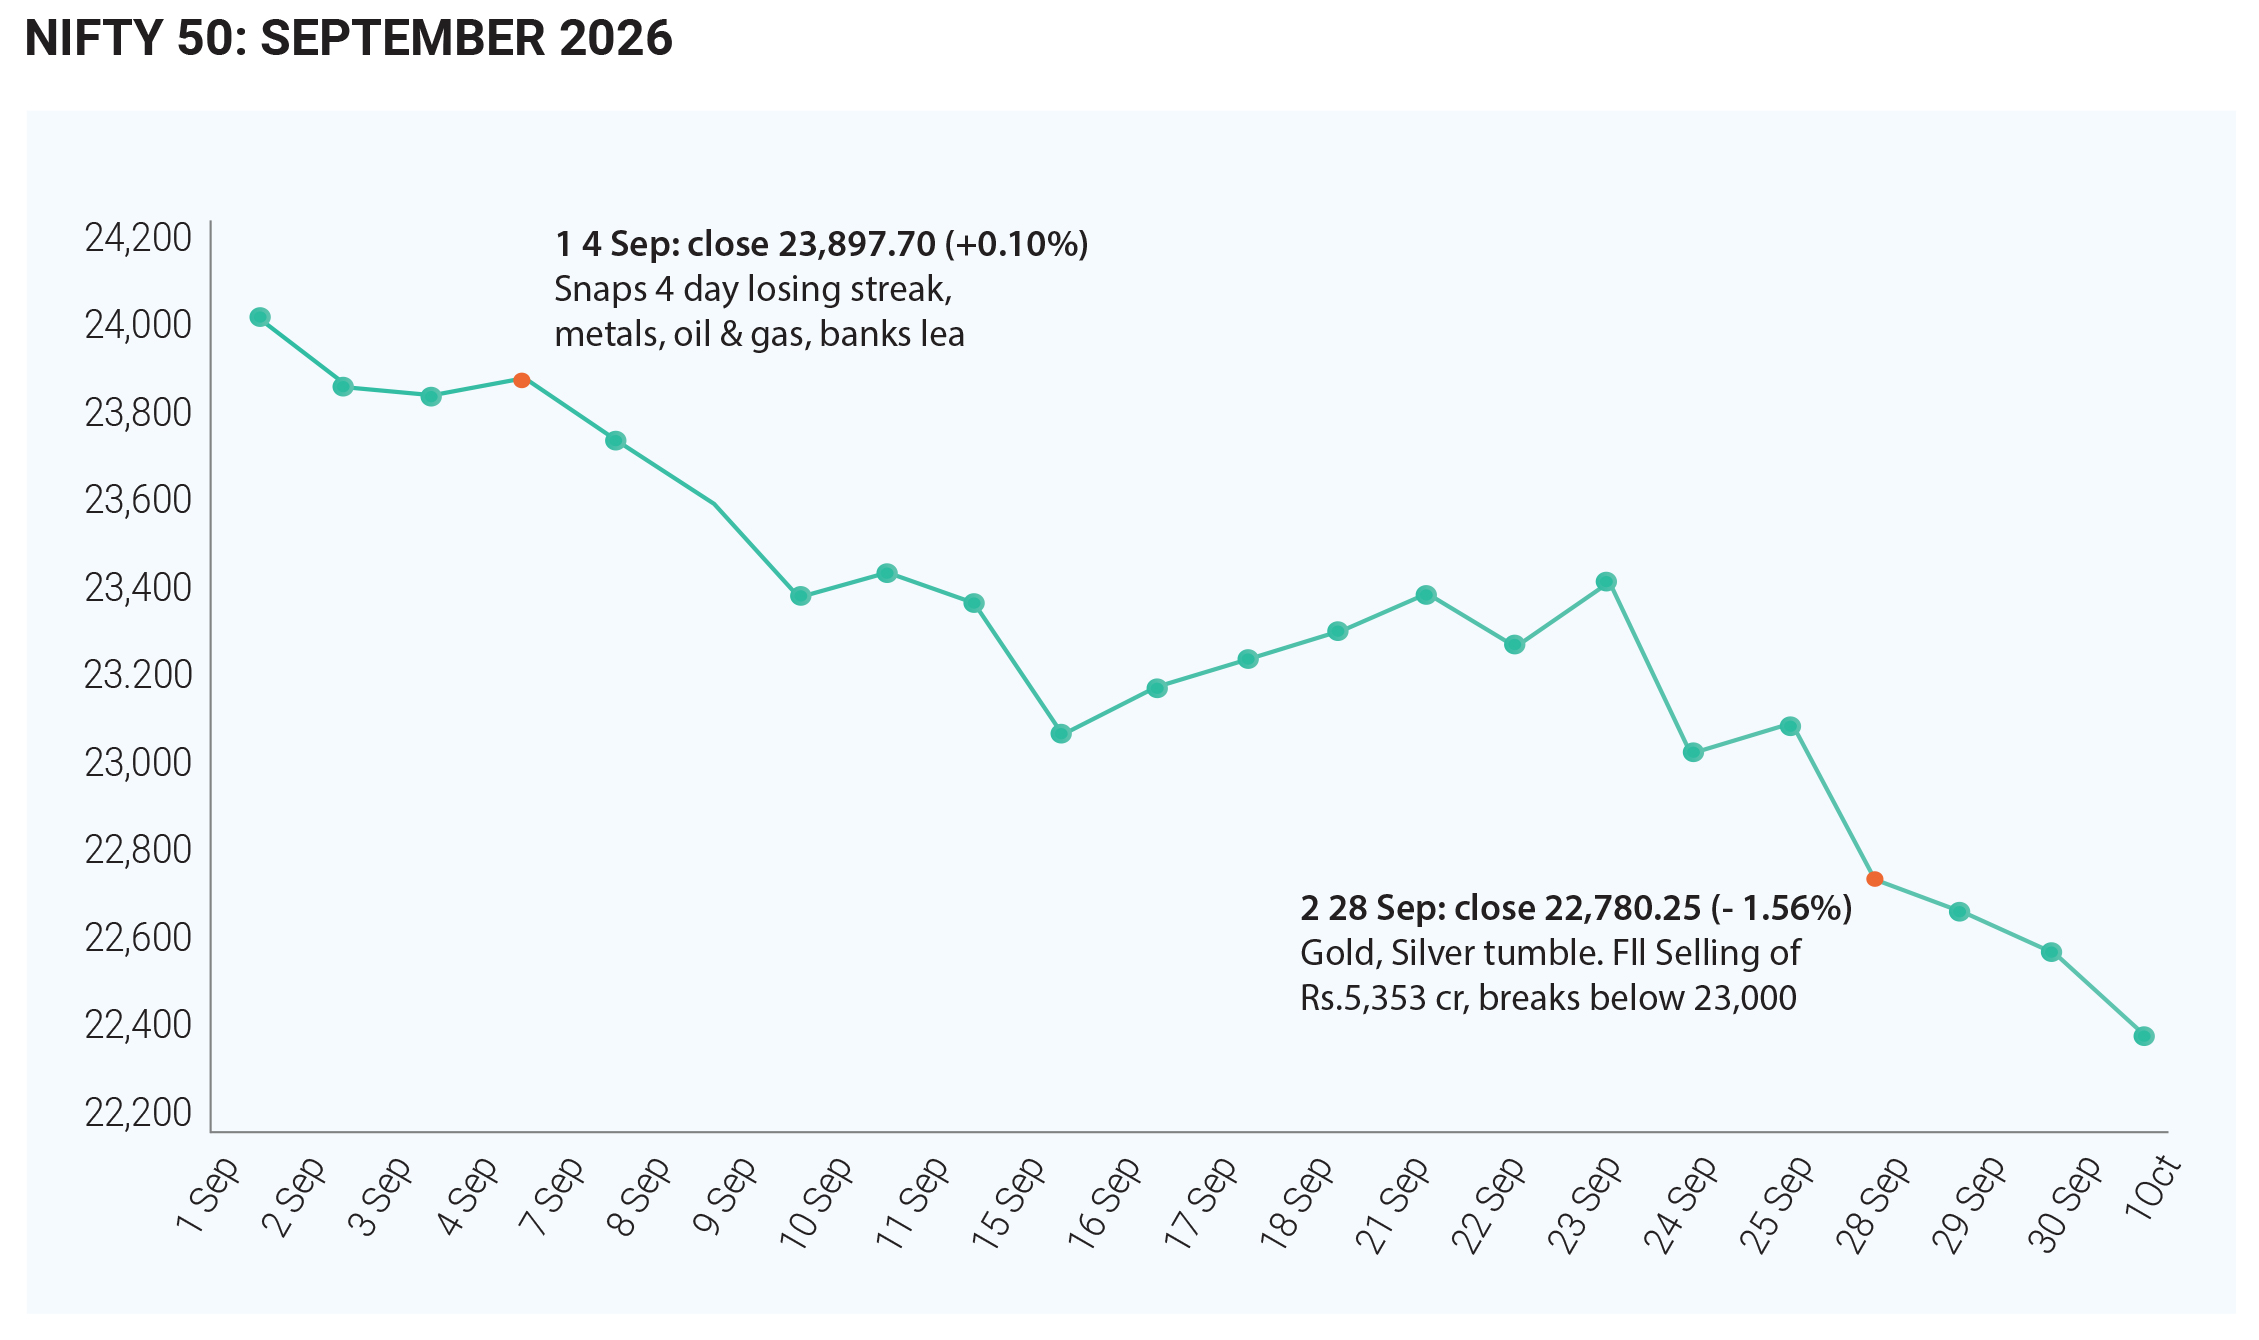
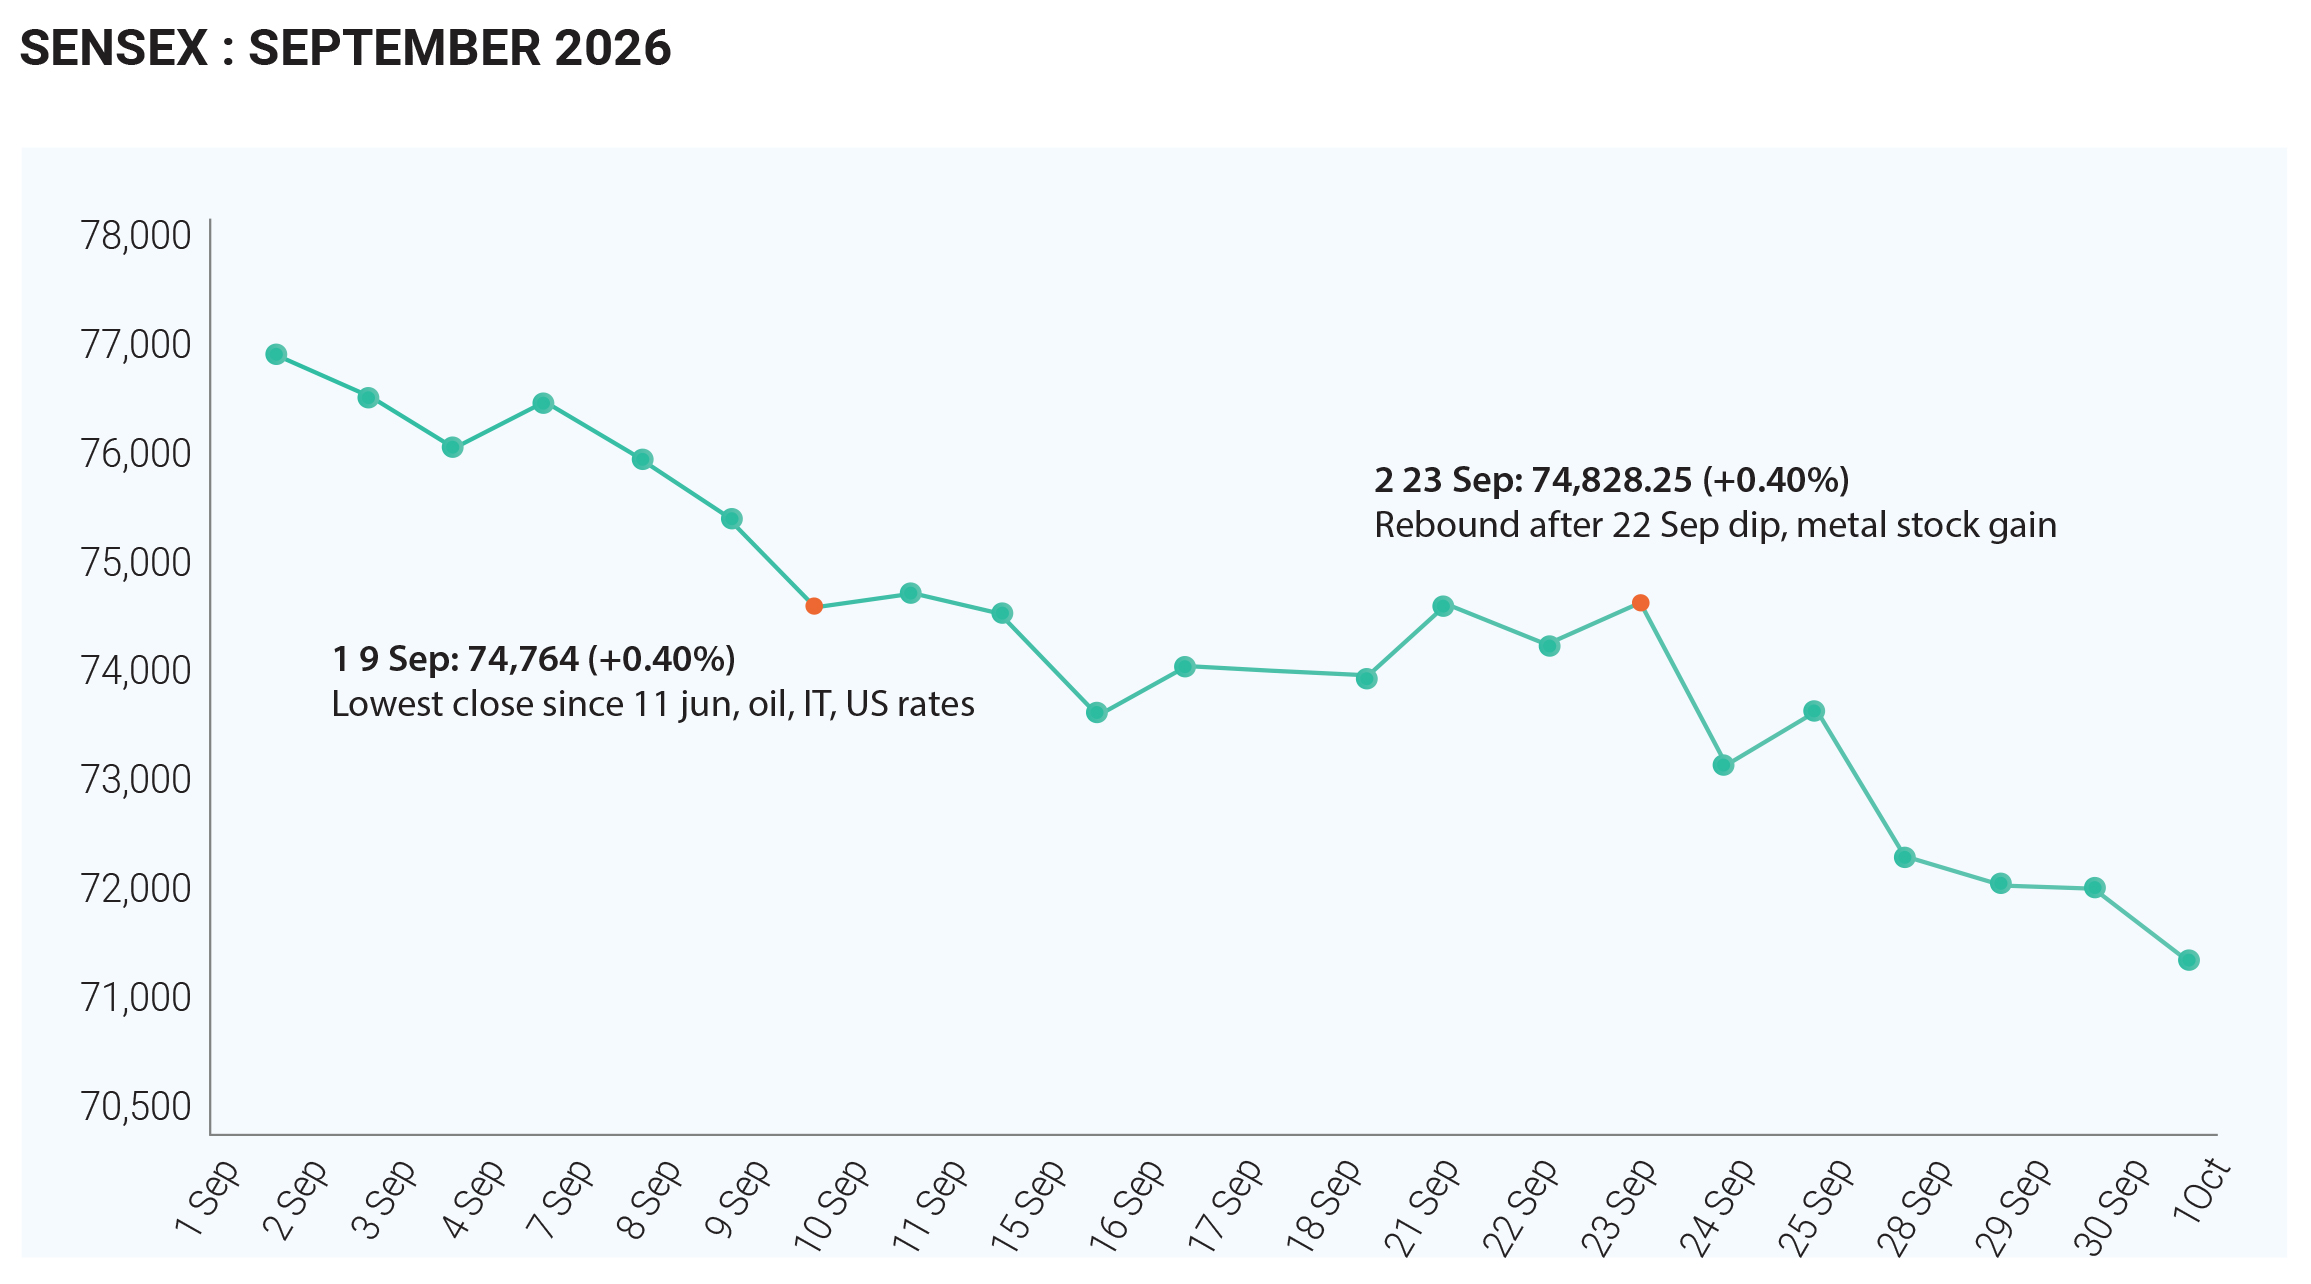
The month unfolded in stages. Markets were cautious early on because of geopolitical tensions, and the correction intensified as crude oil rose and foreign selling resumed. By mid-month, the Sensex had already lost more than 2,900 points, or about 3.84%, and the Nifty had slipped below key technical support levels as investors reacted to higher US bond yields, elevated oil and worries about the Federal Reserve's policy path. Volatility was high. On 15th September, the Sensex opened 655 points higher but closed 778 points lower, a 1,432-point round trip. On 29th September the Nifty broke below the psychologically important 22,600 level while the Sensex fell more than 1%. On 30th September, the Nifty ended down 0.42% and the Sensex down 0.07% The primary factor was a crude oil shock. Brent rose above 100 to 105 dollars per barrel, and by some accounts reached 107 to 108, on Middle East supply and shipping concerns, including a stalemate in US-Iran peace talks and fears of disruption through the Strait of Hormuz. For India, costlier oil widens the import bill and the current account deficit, raises inflation risks, squeezes corporate margins and weakens the rupee. The rupee slid toward and beyond 96 per dollar, adding to worries about imported inflation and tighter domestic financial conditions. Global yields were the second major pressure. The US 10-year Treasury yield rose above 5.2%, its highest level since 2007. That made dollar bonds more attractive relative to emerging-market equities and raised the discount rates applied to Indian corporate earnings, reducing the valuations investors were willing to pay, especially for growth stocks. Firm yields, higher crude and a weaker rupee also raised concerns that inflation would stay sticky and that the Reserve Bank of India might hold policy tight, further pressurising rate-sensitive sectors such as banks, financials, real estate and consumer businesses. Domestic data added to the caution: August CPI inflation was a hotter-than-expected 4.82%, and Maharashtra declared drought in 74% of its talukas, raising concerns about rural demand. A busy IPO calendar and heavy block-deal supply also absorbed part of the available domestic liquidity Foreign institutional investors (FIIs) were decreasing their exposure which have turned from net buyers in July and August to aggressive sellers. FII net selling was about 44,013 crore rupees, across 16 of 21 sessions, with another estimate of about 2.7 billion dollars in outflows, and according to the NSE series, put it at about 33,864 crore across 15 of 20 sessions, with a largest single-day sale of about 9,980 crore on September 29. The selling created broad pressure on large caps in financials, IT and other heavily owned sectors, which dominate both the Nifty and the Sensex. Domestic institutional investors (DIIs) acted as the counterweight. They bought roughly 64,759 crore rupees net and were buyers in all 20 sessions, which kept the combined institutional flow positive at about 30,894 crore. Their buying rests on steady household SIP inflows, which were about 32,297 crore in August with net equity inflows of about 29,329 crore, as well as insurance premiums and mandate-driven allocations. Reportedly it was their 38th straight month of net purchases, and for 2026 so far, DIIs had bought about 6.28 lakh crore against FII selling of about 3.93 lakh crore. The decline was broad but not universal. IT stocks were among the weakest because of their sensitivity to US yields and global risk aversion, financials and other rate-sensitive names suffered from higher yields, and oil-importing, margin-sensitive businesses were hurt by crude and the rupee. A few Nifty constituents bucked the trend, with Coal India, Adani Ports and Dr Reddy's among the limited gainers, rising by as much as 13%, and defensive, commodity-linked and selected export-oriented stocks held up better than the market. Nearly 95% of the mutual fund schemes evaluated also posted negative returns for the month. To summarise September was mainly a macro-driven correction in valuations and liquidity rather than an earnings shock. The chain ran from Middle East tensions to higher crude, then to rupee and inflation concerns, then to higher yields and FII selling, and finally to lower Nifty and Sensex levels. Sentiment stayed fragile throughout, and analysts expect caution to continue until global inflation and geopolitical stability become clearer. In short, the Nifty (about -6.06% to -6.7%, closing at 22,620.45) and the Sensex (about -5.8%, closing at 72,480.29) fell together on the same global forces, with heavy foreign selling only partly cushioned by strong domestic buying.
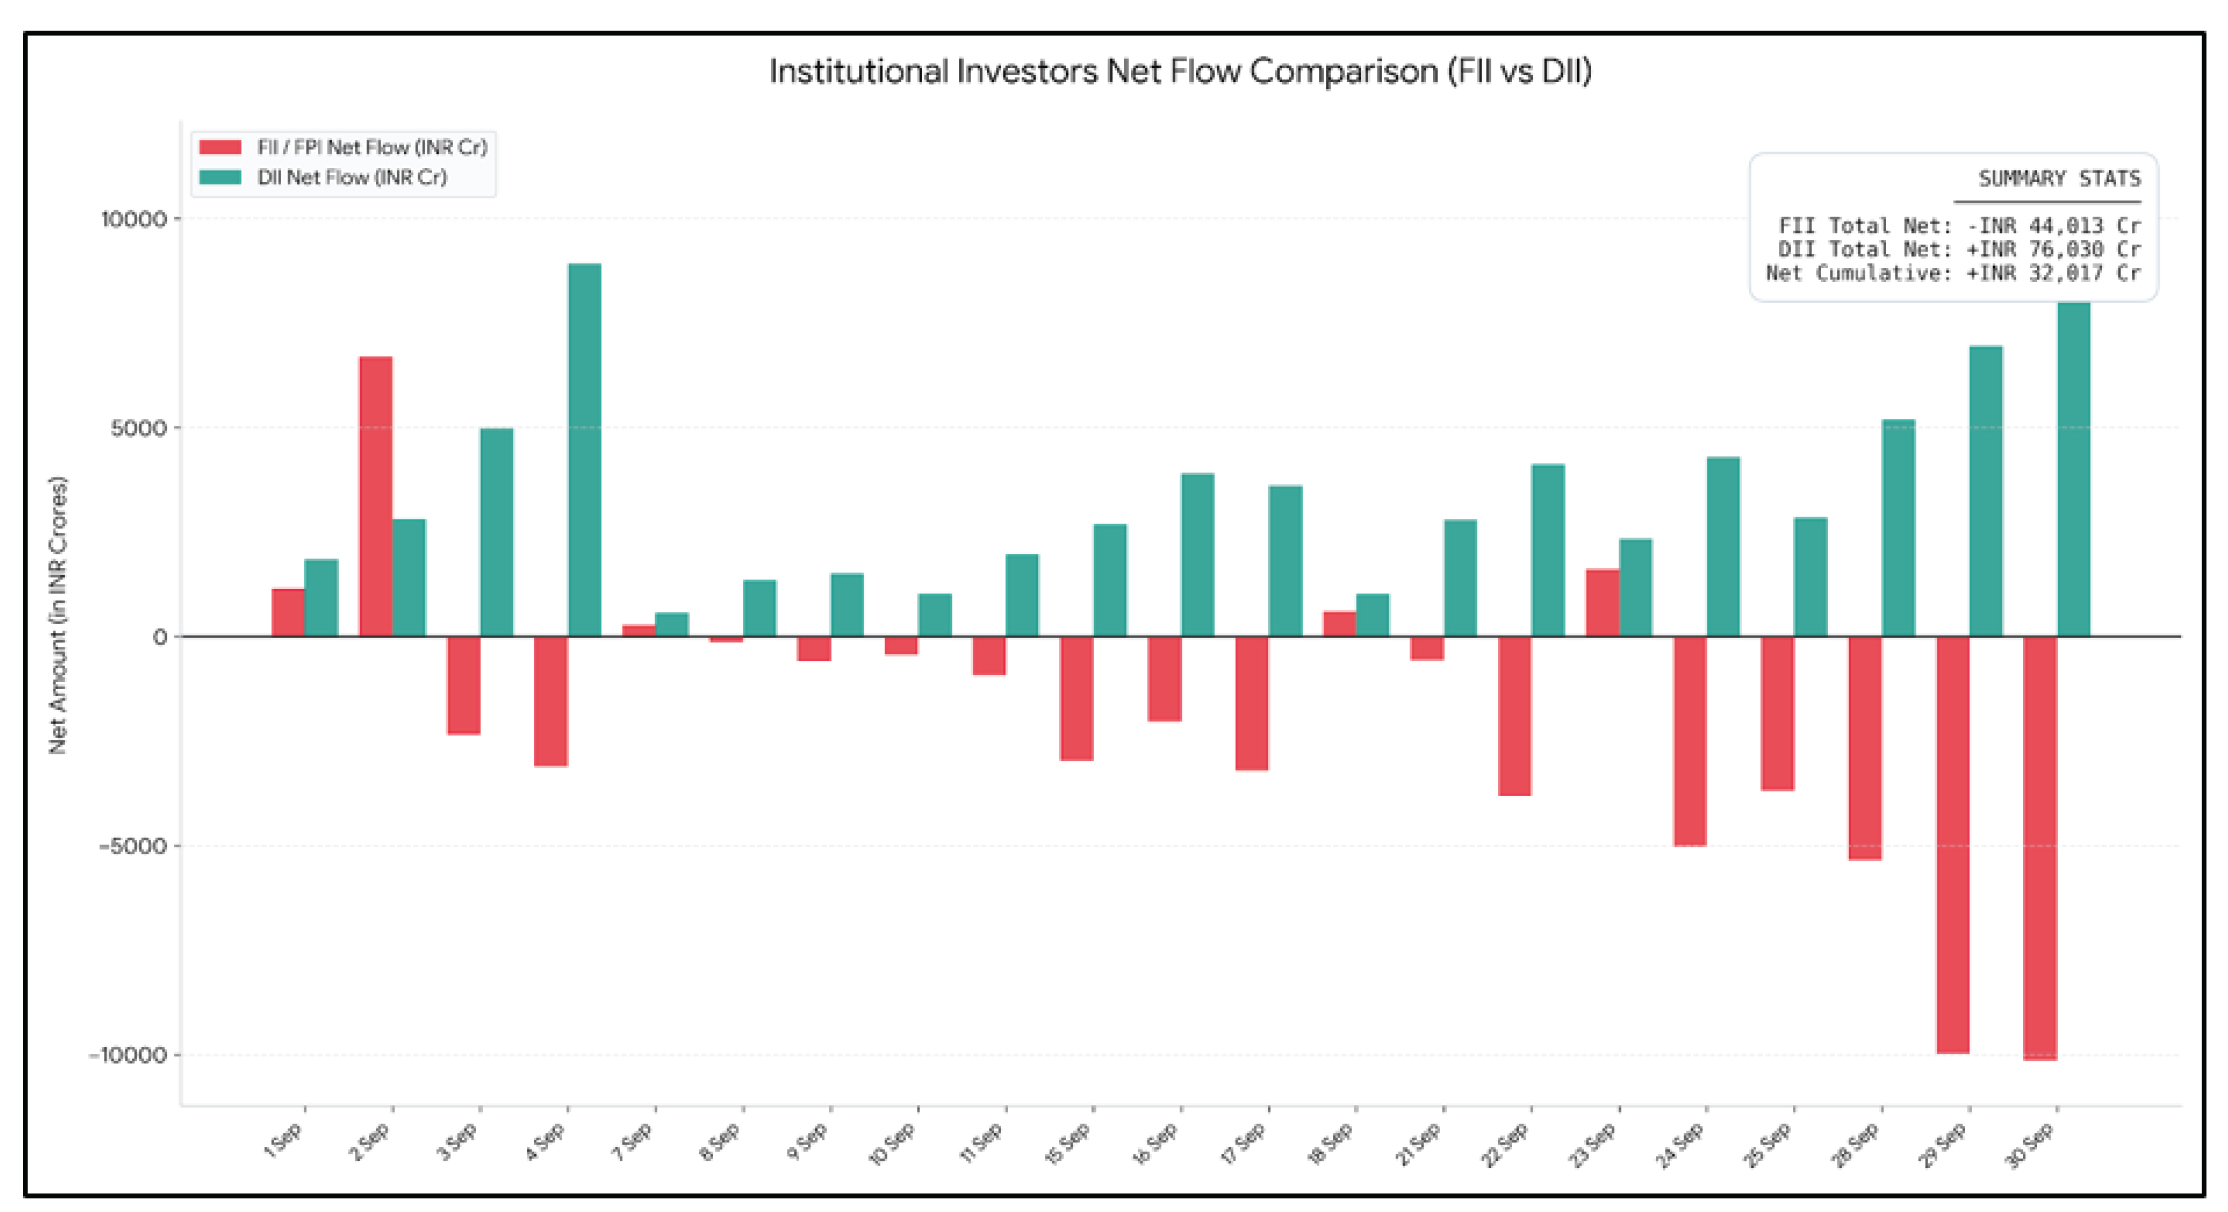
The impact of FII selling was, however, partly absorbed by strong domestic institutional participation. DIIs, including mutual funds, insurance companies and other domestic financial institutions, remained consistent buyers, recording net purchases of ₹62,220 crore in the exchange cash-market data. Their buying was supported by continued domestic investment flows and helped provide liquidity during periods of foreign selling. Interestingly, foreign investor sentiment improved towards the end of October, with FPIs returning as net buyers and infusing approximately ₹6,300 crore during the final week, October 26–30. This reversal, along with improving corporate earnings and domestic buying, contributed to the recovery in benchmark indices. It is worth noting that depository-based FPI flow figures and exchange-based FII cash-market figures differ because they cover different transaction categories and settlement periods. Depository data separately reported net equity outflows of approximately ₹34,843 crore for October. On the domestic front, the Reserve Bank of India's monetary policy decision also influenced investor sentiment. The Monetary Policy Committee raised the repo rate by 25 basis points to 5.50% on October 7, shifting towards a calibrated tightening stance amid inflationary concerns. The rate hike initially weighed on interest-rate-sensitive sectors, particularly banking and other businesses dependent on borrowing costs, as investors assessed its implications for credit growth, consumption and corporate profitability. Nevertheless, the market witnessed a notable turnaround during the latter half of the month, supported by relatively resilient September-quarter corporate earnings and improving investor confidence. The information technology sector emerged as the strongest performer, with the Nifty IT index gaining approximately 17.69%, supported by encouraging quarterly results, growing interest in artificial intelligence-led business opportunities and attractive valuations following earlier corrections. Positive earnings announcements from selected companies also encouraged selective investment in large-cap stocks. Furthermore, expectations of a possible reduction in the long-term capital gains tax rate from 12.5% provided an additional boost to sentiment, although no such policy change had been officially announced. Despite the recovery in benchmark indices, broader market performance remained subdued. The Nifty Midcap 100 and Smallcap 100 declined by
In September 2026, India's debt market came under broad pressure, with yields rising across government securities (G-secs), corporate bonds and money-market instruments before a partial recovery late in the month. The move was driven by higher crude oil, a global bond sell-off led by US Treasuries, sticky inflation, expectations of a hawkish Reserve Bank of India and heavy domestic bond supply, the same forces that hurt equities during the month. In the government bond market, the benchmark 10-year yield rose from roughly 6.95% to 7.00% at the start of September to a peak near 7.18%, a two-year high, in late September. It then eased slightly to about 7.15% to 7.17% by month-end. That amounted to a rise of about 20 to 25 basis points over the month, and about 43 basis points since the end of June, when the yield stood at 6.74%. Large domestic auctions, including one of 340 billion rupees, drew robust demand but still cleared at higher yields, and the benchmark 6.94% 2036 gilt touched about 7.14% intraday at one point. Four factors explain the move. First, Brent crude above 105 to 108 dollars raised imported inflation and fiscal concerns. Second, the US 10-year yield near 5.2%, its highest in about two decades, triggered a global bond rout that lifted Indian yields through risk-premium and carry channels. Third, August CPI inflation of 4.82% and a recent Fed hike strengthened expectations that the RBI would raise rates, with the market pricing an increase at the October 7 meeting. Fourth, heavy government borrowing, including an H2 FY27 gross borrowing plan of 7.86 trillion rupees and large weekly auctions, kept supply in focus, even though the government trimmed the share of 5- and 10-year papers to steady the curve. As a result, G-sec prices fell, and yields rose, with a modest pullback near month-end on a slightly softer oil and borrowing mix. Corporate bond yields also edged higher, tracking the G-sec move, but spreads over G-secs widened as investors demanded extra compensation for volatility. Banks and other institutions stepped up participation in high-quality corporate paper because the wider spread offered better carry than gilts. New issuance continued, including from REITs and NBFCs, but pricing reflected the higher rate environment, and some deals used floating-rate structures to manage duration risk. Corporate behaviour followed from several causes: the pass-through of higher risk-free rates lifted the whole curve, so issuers had to pay higher absolute yields. Global risk aversion, FII equity selling and oil and inflation worries raised term and credit premiums, particularly for lower-rated names. At the same time, banks rotated some allocation into investment-grade corporates for extra yield, which supported primary issues. The net effect was higher absolute yields and wider spreads, but demand for good credits. In the money market, the call money rate hovered near the RBI's standing deposit facility rate of about 5.00%, reflecting ample system liquidity despite large advance-tax outflows of roughly 1.7 trillion rupees. Short-tenor yields firmed, with the 364-day T-bill auction cut-off rising to about 6.04%, the highest since April 2025, which signalled higher pricing at the short end. RBI open market operations, including gilt sales, and tax outflows created episodic tightness, but liquidity stayed in surplus overall and capped any sharp spike in overnight rates. The main reason for the short-end move was the market's expectation of a near-term policy rate hike, since inflation sits above the RBI's 4% target and global central banks are hawkish. This lifted short-end yields even while liquidity was comfortable, and the tax-related drain was too temporary to cause sustained stress.
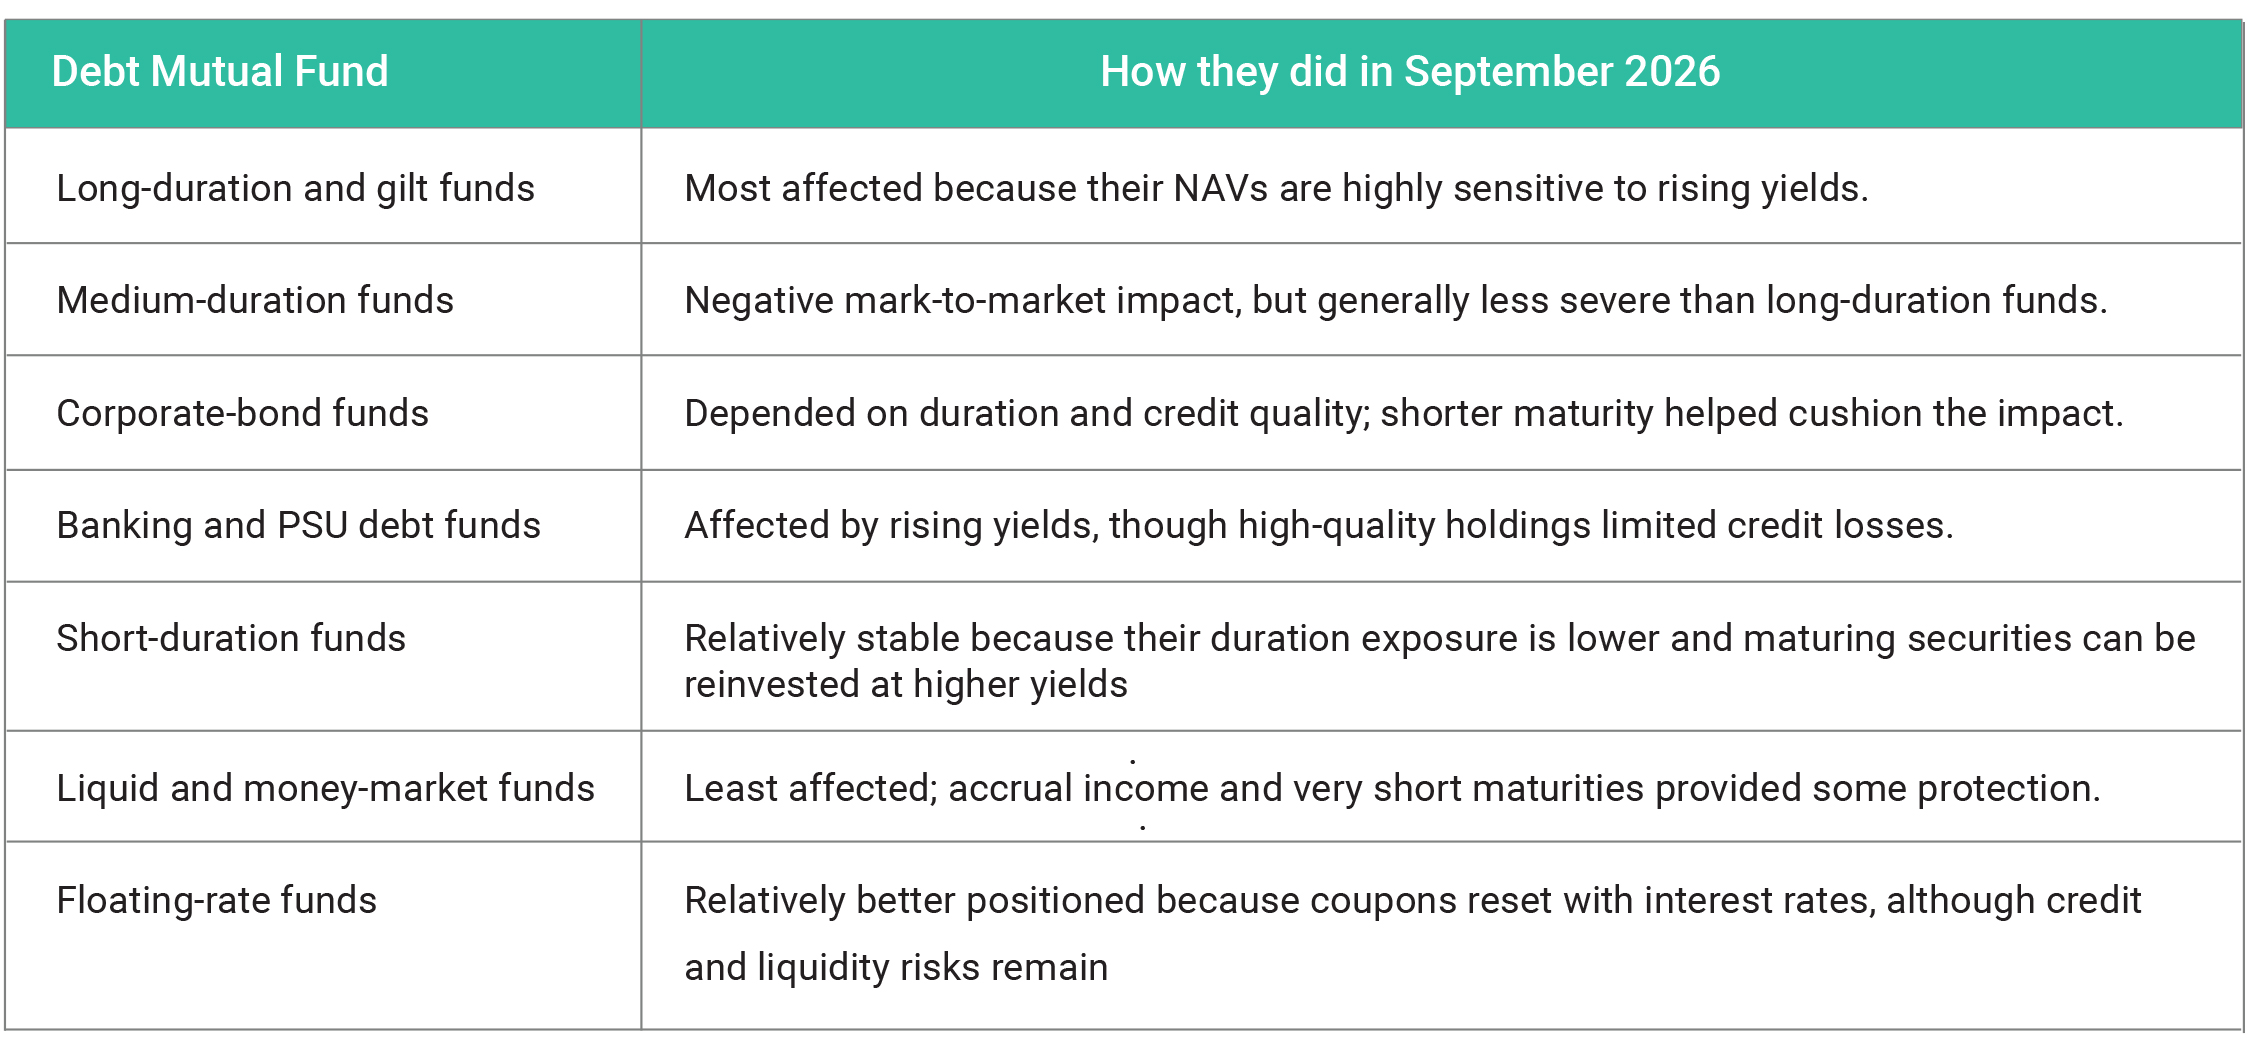
Taken together, the segments tell a consistent story. G-secs saw yields rise by about 20 to 25 basis points to roughly 7.15% to 7.17%, driven by crude above 105 dollars, US yields near 5.2%, the 4.82% CPI print, rate-hike expectations and heavy supply. Corporate bonds saw higher yields and wider spreads, with banks rotating into investment-grade names as G-sec pass-through and higher term and credit premiums played out. The money market saw higher short-end yields, with the 364-day T-bill near 6.04% and call money steady near 5.00%, as inflation and global hawkishness fed rate-hike pricing while ample liquidity limited volatility. The overall picture is of a debt market repricing for a more hawkish policy path, with the partial late-month recovery in G-secs offering only modest relief.
In September 2026, gold and silver corrected sharply in India and globally after a strong August rally. MCX gold fell below 1.50 lakh rupees per 10 grams, and silver slipped from its recent highs. The decline was driven by a hawkish US Federal Reserve, surging US yields, a stronger dollar and spiking crude oil, which together outweighed the usual safe-haven and festive-demand support. On the price side, international spot gold eased from recent highs to around 4,265 dollars per ounce by mid to late September, touching one-week lows as rate-hike expectations intensified. In India, 24K gold was quoted around 1,51,580 rupees per 10 grams on September 25, down from higher levels earlier in the month. By September 28, MCX gold had dropped below 1.50 lakh rupees, a near seven-week low following a sharp weekly fall. World Gold Council data showed domestic gold prices down about 4.6% for September, following the surge in August. Silver was quoted near 2,34,040 rupees per kg on September 25 and mirrored gold's correction, with headlines on September 28 noting that both metals tumbled as global bullion sold off. Overall, domestic gold fell roughly 4% to 5% in September, and silver followed a similar path after a volatile, range-bound start to the month. The first and most important driver was a hawkish Fed. The central bank raised rates for the first time in three years and signalled further hikes in 2026. Higher real and nominal yields raise the opportunity cost of holding non-yielding assets like bullion, which pressured both gold and silver. Closely related was the surge in US Treasury yields and the stronger dollar. The US 10-year yield hovered at multi-year highs, making bonds more attractive relative to zero-coupon assets such as gold, while the dollar index reached a two-month high, making dollar-priced gold more expensive for overseas buyers. In India, the rupee weakened toward 96 per dollar, which normally supports local bullion prices, but the global price drop was large enough that gold and silver still fell in rupee terms. Crude oil was the third factor. Brent rose above 105 to 108 dollars on Middle East tensions, including the US-Iran stalemate and risks around the Strait of Hormuz. Higher oil lifted inflation expectations, which paradoxically hurt gold in the near term because markets read it as forcing central banks, especially the Fed, to stay hawkish or tighten further. A fourth factor was profit-booking after the steep August rally, which made part of the September decline technical. Global gold ETF flows also softened, removing one source of investment demand. In India, festive and wedding demand stayed resilient, but price volatility and elevated levels weighed on jewellery demand and limited a strong physical bid during the correction. The weaker rupee usually supports domestic bullion but was insufficient to offset the large fall in international prices. On the seasonal front, physical demand was steady but not aggressive at elevated prices, and domestic discounts widened slightly. Investor behaviour was also supportive but limited, as ETF and digital gold demand stayed positive but not strong enough to counter the global macro headwinds. In summary, downward pressures on bullion were FED rate hike and "higher for longer" expectations, US 10-year yields at multi-year highs, a stronger dollar, crude above 100 dollars feeding inflation fears and more hawkish central bank pricing, and profit-booking after August, along with softer global ETF flows. Other factors were West Asia geopolitical risk, Indian festive and wedding demand with steady physical investment, and rupee depreciation, which partly offset global declines. The net result was a correction of about 4% to 5% in Indian gold and silver in September 2026, with MCX gold breaking below 1.50 lakh rupees per 10 grams, caused mainly by global rate, yield and dollar dynamics amplified by the oil spike, despite underlying geopolitical and seasonal support.
The Indian rupee weakened against the US dollar in September 2026, showing a volatile, intervention-managed depreciation. The rupee started the month with near 94.95 per dollar, slipped past 96.00 mid-month, touched a low near 96.16 and closed around 95.93. The rupee briefly breached the psychologically important 96 mark and hit a two-month low as oil prices rose. The month began on a firmer note, with the rupee reaching roughly 94.30 to 94.49 early on, helped by temporary support: dollar selling by foreign banks, non-resident deposits under the FCNR(B) swap window, index-related inflows and RBI-backed dollar supply. That support faded as the trend reversed. Crude oil climbed above 100 dollars and toward 107 amid Middle East supply concerns, raising India's import bill and its demand for dollars. Foreign investors sold Indian assets heavily, with the second account reporting about 3.7 billion dollars withdrawn during the month. Elevated US Treasury yields, a firm dollar index and a Federal Reserve rate hike made dollar assets more attractive and pressured emerging-market currencies generally. The Reserve Bank of India limited the damage through dollar sales by state-run banks and FX swaps, particularly near 96, which appeared to act as an informal line of defence. This capped losses and calmed sharp swings but only moderated the decline, since the underlying pressure from oil, yields and outflows remained. The rupee's move fits the wider picture from the earlier texts. The same forces, crude above 105 dollars, US 10-year yields near 5.2% and heavy foreign selling, drove the Sensex down about 5.3% to 5.8% and the Nifty down about 5.7% to 6.7%. Estimates of foreign equity outflows differ by source, from about 17,000 crore to 44,000 crore rupees, but all point to dollar demand that weighed on the currency. Domestic institutions bought heavily, yet that supported equities rather than the rupee. In the bond market, the 10-year G-sec yield rose about 20 to 25 basis points to roughly 7.15% to 7.17%, with markets pricing an RBI rate hike on October 7 after August CPI inflation of 4.82%. A weaker rupee adds to imported inflation, which reinforced that expectation, while the 364-day T-bill cut-off near 6.04% and call money steady near 5.00% showed the short end pricing a hawkish path despite ample liquidity. Gold offers a useful contrast. A weaker rupee normally lifts domestic bullion prices, but the global fall was large enough that Indian gold still dropped about 4% to 5% and fell below 1.50 lakh rupees per 10 grams. In short, the rupee lost ground because crude oil, high US yields and foreign outflows outweighed the early-month inflows, while RBI dollar sales slowed, but did not stop, the depreciation. rupees, but all point to dollar demand that weighed on the currency. Domestic institutions bought heavily, yet that supported equities rather than the rupee. In the bond market, the 10-year G-sec yield rose about 20 to 25 basis points to roughly 7.15% to 7.17%, with markets pricing an RBI rate hike on October 7 after August CPI inflation of 4.82%. A weaker rupee adds to imported inflation, which reinforced that expectation, while the 364-day T-bill cut-off near 6.04% and call money steady near 5.00% showed the short end pricing a hawkish path despite ample liquidity. Gold offers a useful contrast. A weaker rupee normally lifts domestic bullion prices, but the global fall was large enough that Indian gold still dropped about 4% to 5% and fell below 1.50 lakh rupees per 10 grams. In short, the rupee lost ground because crude oil, high US yields and foreign outflows outweighed the early-month inflows, while RBI dollar sales slowed, but did not stop, the depreciation.
Crude oil rose sharply in September 2026, driven mainly by Middle East supply fears rather than any improvement in global demand. Brent gained about 14% for the month, its strongest monthly rise since July, and ended around 103.5 to 103.7 dollars per barrel, while WTI rose about 5% to roughly 90 dollars. The month unfolded in stages. Early in September, Brent climbed from the low 90s to about 97.31 dollars as the US-Iran conflict intensified and worries grew over disruption to Middle Eastern supply. On September 10, prices jumped more than 6% in a single session, with Brent settling at 107.63 dollars and WTI at 102.48 dollars after attacks on shipping and renewed fears about traffic through the Red Sea and the Strait of Hormuz. In late September, Brent briefly approached 108 dollars but then fell about 2% as markets weighed a possible US-Iran truce and signs that Saudi export flows were recovering. Prices still ended the month well above where they began, because ceasefire hopes weakened and uncertainty over Gulf exports persisted. The main driver was a supply-risk premium tied to the conflict. Attacks on tankers raised fears for the Strait of Hormuz, a critical export route, while Houthi attacks and wider fighting threatened Saudi and other Gulf energy infrastructure. OPEC+ left its October production targets unchanged, though actual output was affected by disruptions. OPEC also cut its 2026 demand growth forecast for the fifth time in a row, but the immediate supply shock outweighed that weakness. Brent rose far more than WTI because it is more sensitive to Middle Eastern and seaborne supply disruptions. Several factors capped the rally: possible peace or truce talks, the recovery of some Saudi and UAE exports including shipments from Yanbu and pipeline restarts, evidence that Hormuz flows were broadly holding up, and reports of higher US inventories alongside concerns about weaker global demand. For India, the surge matters greatly because the country imports nearly 90% of its crude. Higher prices increased the import bill, added downward pressure on the rupee, which traded near 95.98 to 96.15 per dollar, and prompted the RBI to use dollar sales by state-run banks to stabilise the currency. Overall, September's oil rally was a geopolitical supply story, and it fed directly into the rupee, inflation and market weakness seen across India that month.
Nearly 95% of mutual fund schemes posted negative returns in September 2026, with about 634 of roughly 666 analysed schemes falling. The cause was a broad market correction rather than any problem specific to fund managers, and the text puts the Nifty 50's fall at about 5.56%, with the Nifty and Sensex down roughly 5.7% to 6% by its other estimate. A busy IPO market also absorbed liquidity, and domestic buying did not fully offset foreign selling. Because NAVs are marked to market, the decline in underlying shares showed up almost immediately. Losses were uneven. Technology and thematic funds were hit hardest, with technology-focused and mid-cap schemes losing 6% to 9% or more, and three of the five worst performers falling over 9%. Mid- and small-cap funds were more volatile because of lower liquidity and higher valuations, while diversified funds cushioned losses through cash, defensive sectors or lighter technology exposure. A small group still delivered gains, mainly gold and silver funds, arbitrage funds, short-duration debt and money-market funds, multi-asset funds and some international funds, though gold and silver ETFs overall ended the month in the red after August's rally. Overall, September reflected a systemic, macro-driven correction.